Ensure a network that works for every member.

Violet’s Network Insights uncover how well providers, facilities, and service areas are equipped to deliver personalized care to high-risk member populations—helping health plans close access gaps, improve quality, and reduce total cost of care.


Trusted by the industry’s leading organizations.

%202.png)


The business case for personalized care.

Improve outcomes and engagement.
Providers verified by Violet show a 14% increase in adherence and retention for preventive care visits and a 15.9% improvement in hypertension control.

Lower cost of care.
Violet Verified Providers drive better management of high-burden conditions like hypertension and diabetes—leading to over $5,000 in annual savings per patient.
Win more contracts.
Strengthen RFPs with trusted, comparative data. Showcase your network’s readiness to serve diverse patient populations with care that fits.

Measure, strengthen, and showcase provider quality.


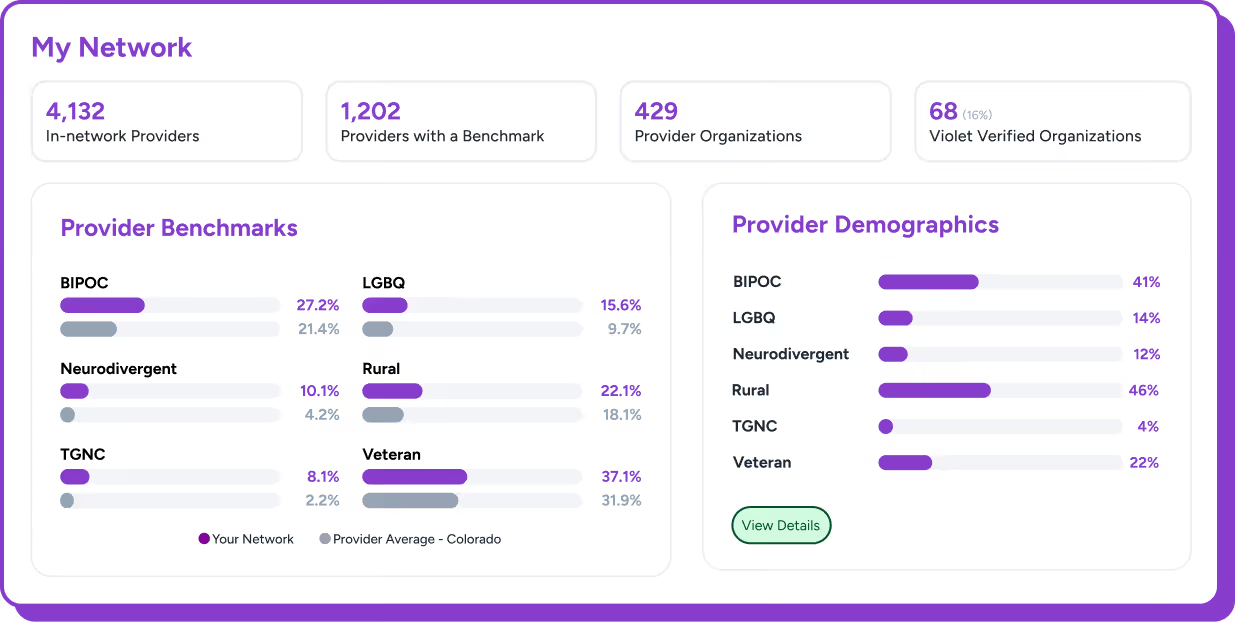
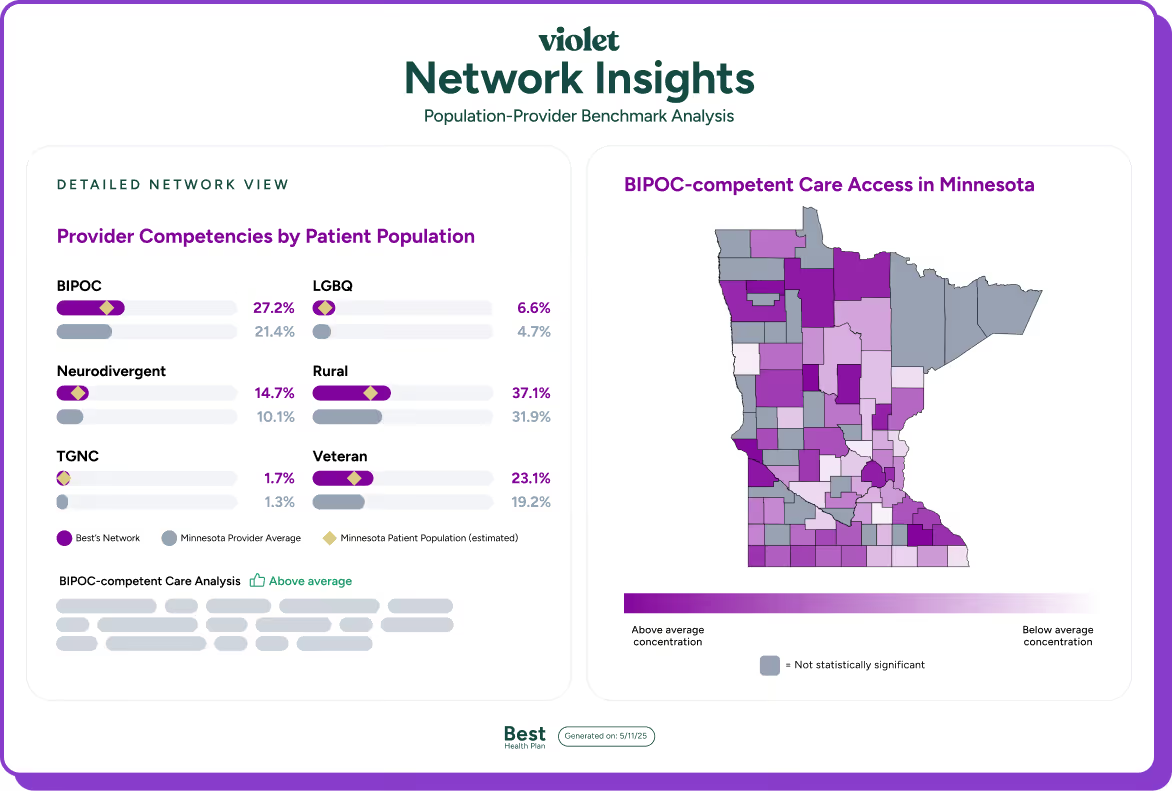
Know your network—and who they’re equipped to care for.
Violet Benchmarks reveal provider capabilities across key populations—including BIPOC, LGBQ, TGNC, Rural, Veteran, and Neurodivergent —so you can understand where your network is prepared to deliver personalized care. View self-reported language skills and demographic data for added context on who your providers are.
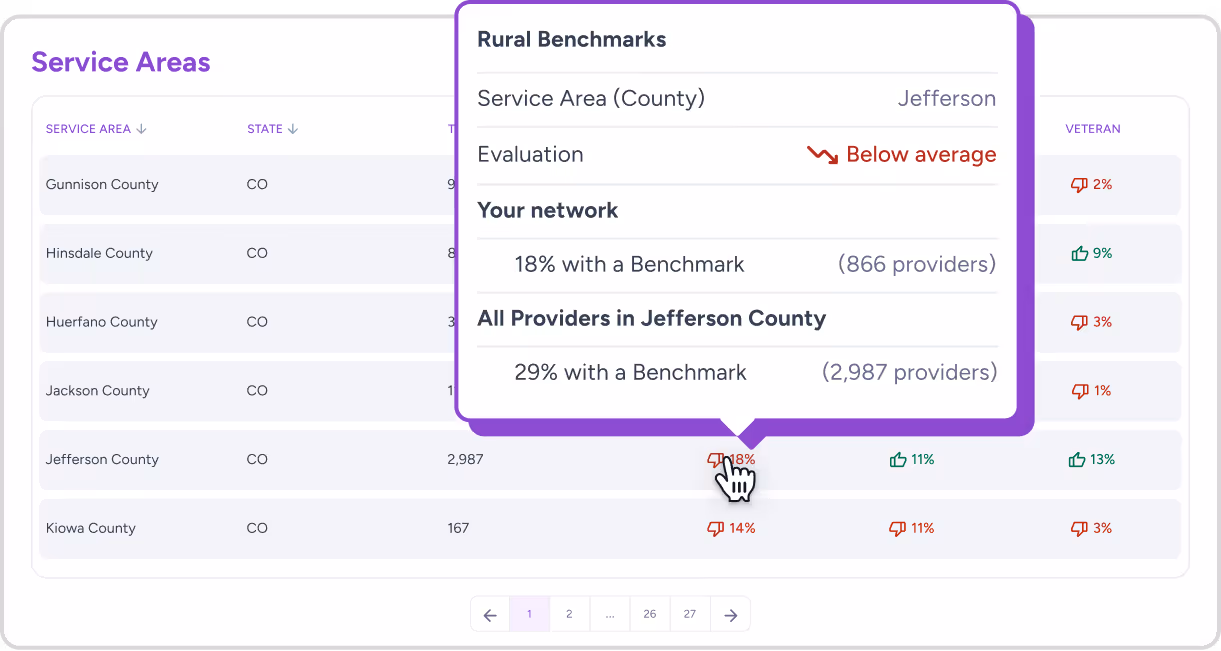
Target access gaps with service-area insights.
Explore specific service areas to determine whether providers with relevant expertise are accessible in the regions that need them most. Use these insights to address gaps through recruitment, partnerships, or localized initiatives.
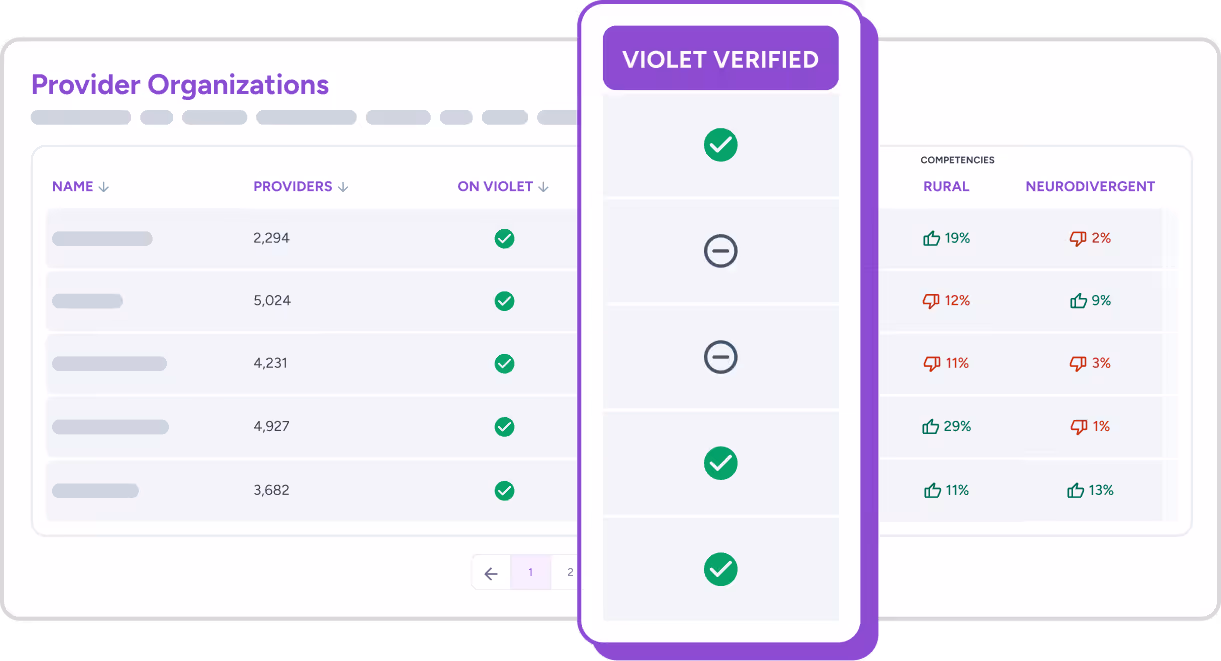
Tie provider performance to value-based payment.
Identify high-performing organizations based on verified provider capabilities with specific patient populations. Leverage Violet data to inform enhanced reimbursement strategies, and qualify groups for participation under value-based payment models.
Track training completion across payers.
Easily assign and track CE/CME courses in one place. A unified, NPI-linked record keeps every provider’s progress across your organization, regardless of who assigned the training.
Strengthen RFPs with comparative data.
Export polished, data-rich PDF reports showing how your network performs against competitors in serving high-burden populations.
Request a demo.